


SUI drops 70% to $1.66 amid forced selling. Analysts eye $1–$1.70 zone as potential accumulation area while network activity stays strong.
Sui (SUI) has dropped to $1.66 following a 70% decline from its all-time high of $5.35. The recent move has drawn attention from analysts, who point to signs of forced selling and potential positioning reset.
With volume rising and the price reaching key levels, traders are watching to see if this marks the start of accumulation.
Price Tests Key Support Levels
Crypto Patel described the move as a “classic capitulation flush,” noting that the $1.7 to $1 range could be viewed as an institutional accumulation zone.
“Forced liquidations complete. Weak hands out. Positioning reset,” he said.
Patel also added that a shift in market liquidity could reopen the path toward higher targets.
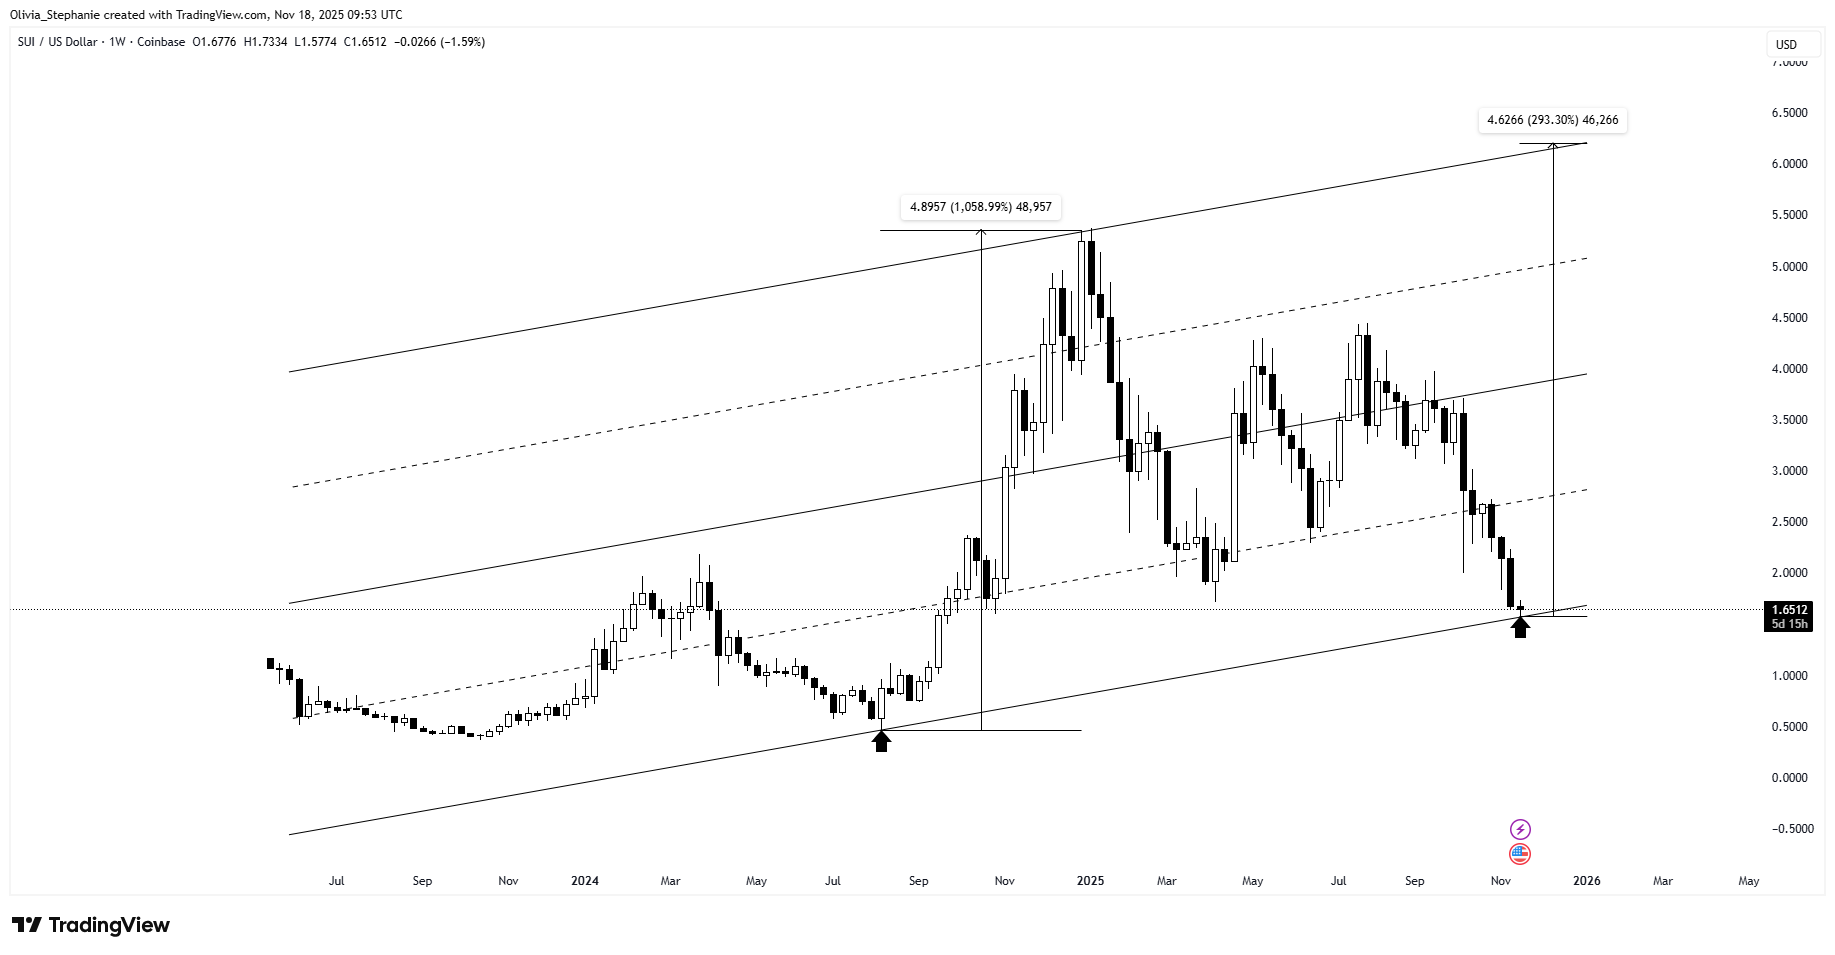
SUI is now testing a key support zone near $1.65. Below that, the $1 to $0.9 range is identified as a deeper support. These zones have held before and are being monitored closely. The price stability above these levels could attract interest, while failure to hold may trigger further decline.
Trend Structure Remains Under Pressure
SUI continues to trade within a broader downtrend, with lower highs forming since early 2025. Daan Crypto Trades noted that the $1.71 area needs to be recovered to confirm a potential bounce. “Looking for this to retake the $1.71 area,” he posted, referring to that level as key horizontal support on the higher timeframe.
SUI is also sitting near the lower boundary of a long-term trend channel. The last time the price reached this line, it climbed over 1,000%. The same level is now being retested. A rebound from here would keep the structure intact. A break below would shift the setup to a weaker outlook.
You may also like:
However, the weekly RSI is reading 35, sitting just above the oversold threshold. This points to ongoing weakness, but also shows that the asset is nearing an area where past reversals have formed.
Meanwhile, the MACD remains in negative territory with a bearish crossover still active. Red histogram bars are growing, which suggests that downward momentum is not yet easing.
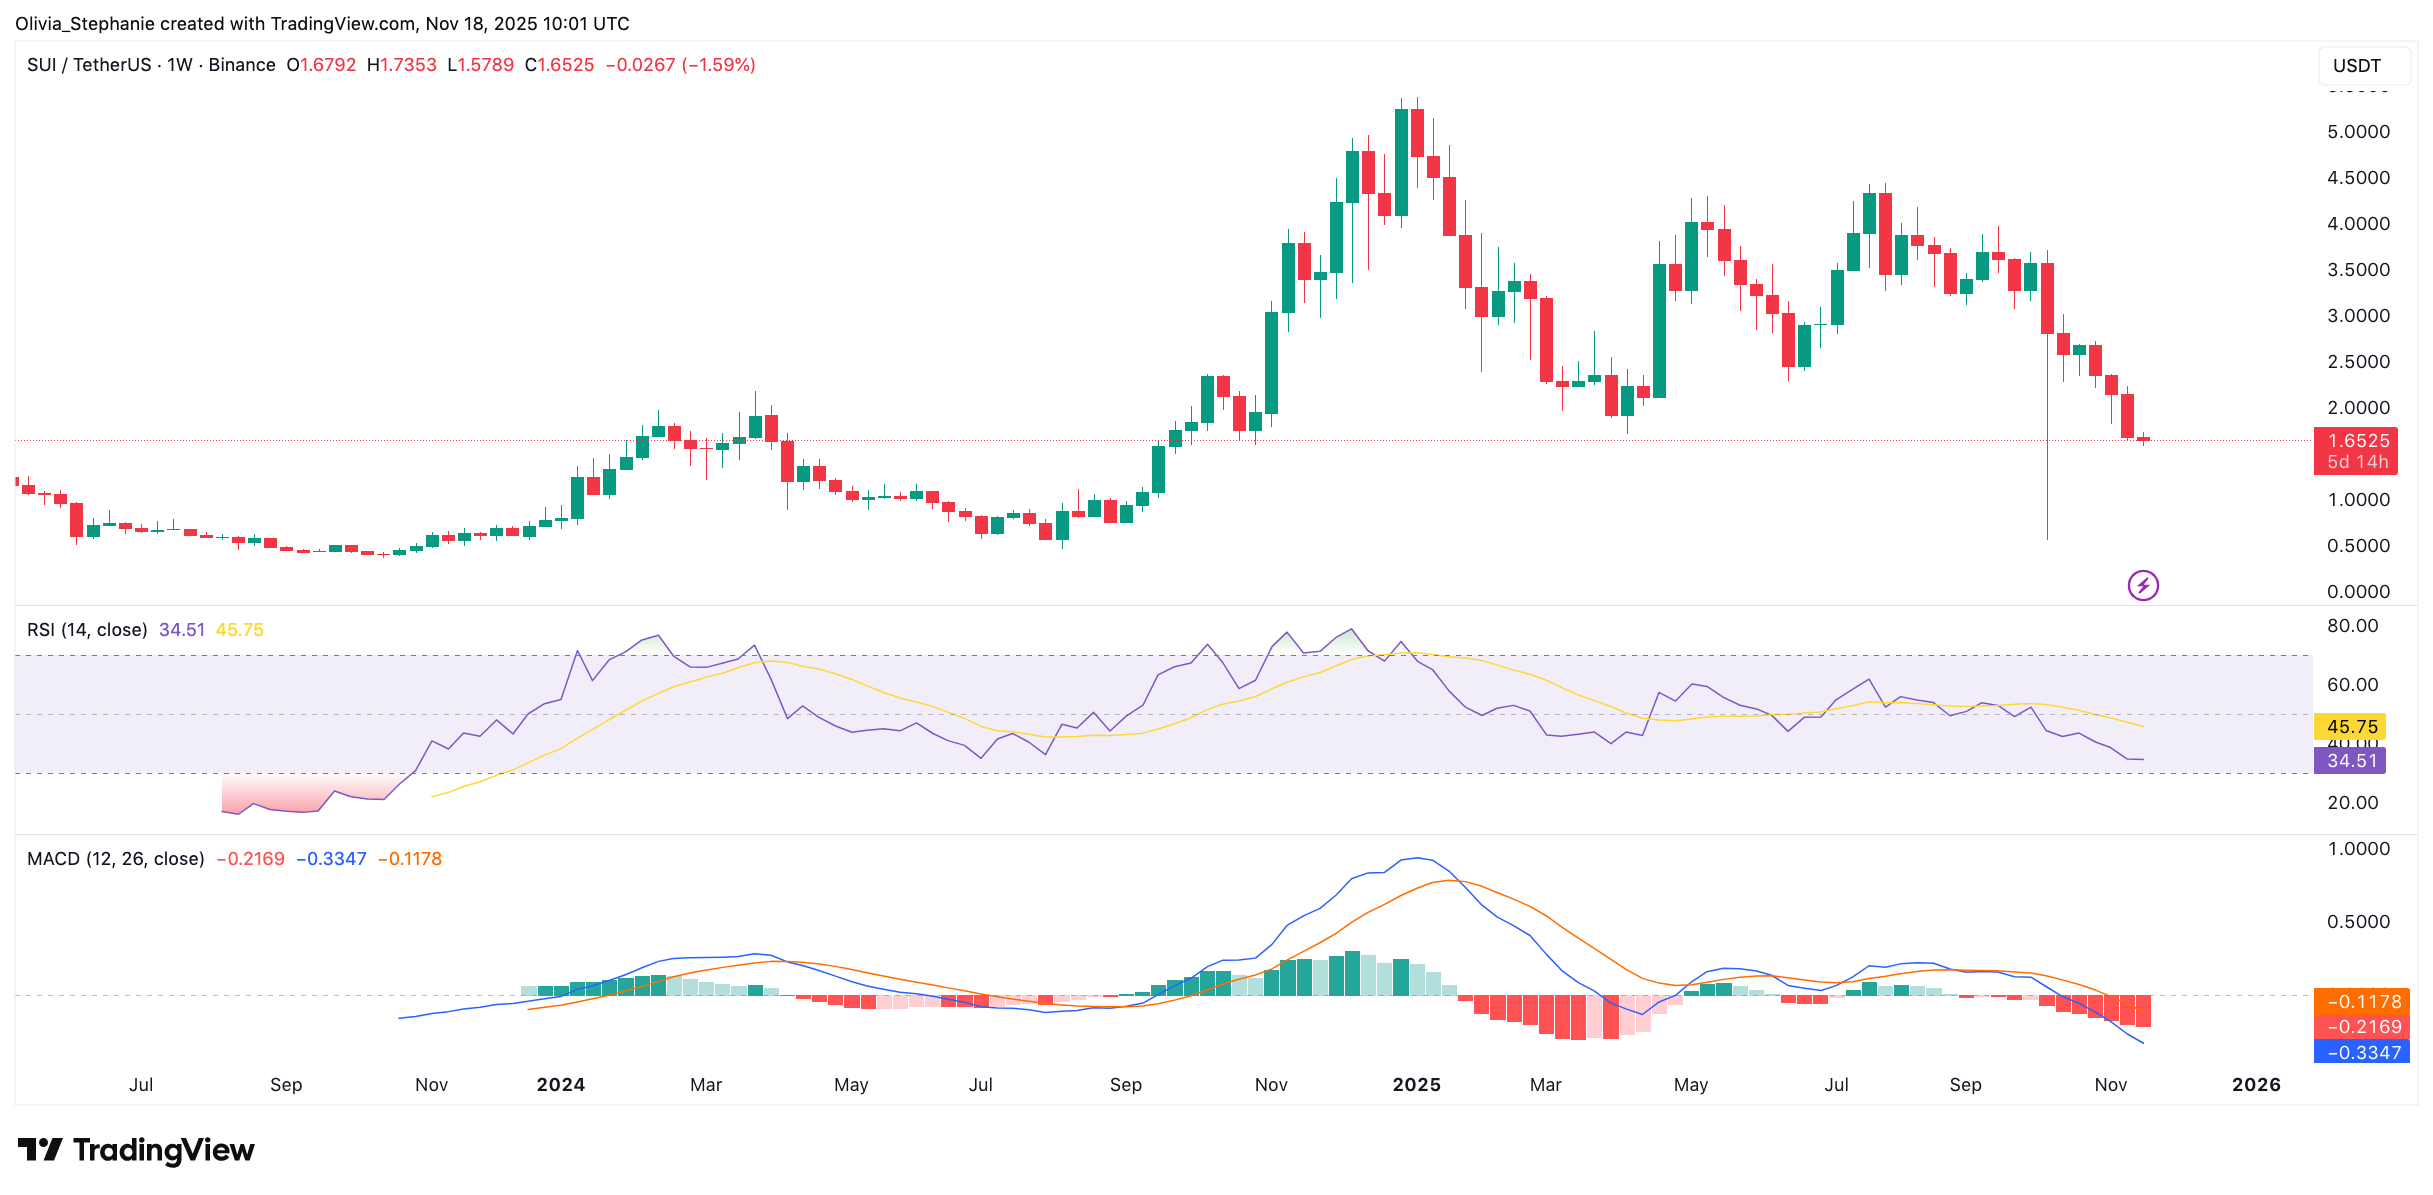
These signals point to a market still under pressure. A shift in trend would need to be confirmed by strength in both price and momentum indicators.
While the token has struggled, activity in the Sui ecosystem remains. Bluefin, a decentralized exchange built on Sui, saw record volume in October. Grayscale launched new investment products tied to projects on the network. As we reported last month, Sui also partnered with Figure Technology to launch the YLDS token, which is backed by short-term Treasurys and repo agreements.
SECRET PARTNERSHIP BONUS for CryptoPotato readers: Use this link to register and unlock $1,500 in exclusive BingX Exchange rewards (limited time offer).