


Key Takeaways
How is Bitcoin’s price action doing?
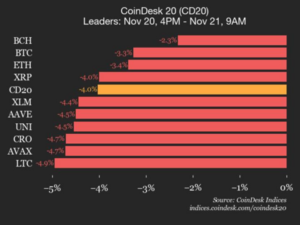
BTC fell down to $85,000 after a sustained correction of 7% in 24 hours.
Is recovery possible for Bitcoin?
The True Market Mean remains the final support level for Bitcoin.
Bitcoin [BTC] has now spent 46 days away from its all-time high, with a press-time value of $85,975 — Marking its eighth day away from the $100,000-threshold.
Bitcoin declining below this level isn’t new. It has closed below the threshold three times this year alone. However, this time may be different, with the growing possibility of a bear market now in the mix.
Fractal pattern in place
A repeating fractal pattern is one technical indicator suggesting that Bitcoin [BTC] has entered a bearish phase. Especially as the crypto’s price continues to form new lows.
This indicator, which has accurately predicted the previous three bear markets, is now suggesting that Bitcoin has once again entered this cycle. In fact, the data seemed to indicate that the shift may have begun ten days ago.

Source: Alphractal
Speaking on the development, João Wedson noted that while macroeconomics plays a role in determining Bitcoin’s trend, there comes a point where the asset begins to decouple.
“When the price is at an ATH or at a historical bottom — in those extremes, Bitcoin completely breaks its correlation with traditional assets.”
Bitcoin’s latest decline is already pointing in that direction. Market analysis has also revealed that buyers who entered the market in the last 14 months are now recording major losses.
In the derivatives market too, such a sentiment is equally clear. Hyperliquid, for instance, found that 96% of its traders over the past six months are now sitting at a loss.
Tendency remains tilted lower
The likelihood that Bitcoin could remain in this phase for an extended period has been reinforced by the Delta Growth Rate turning negative. This indicator compares the growth of market capitalization to the growth of realized capitalization.
When it turns negative, it implies that Bitcoin is losing support relative to on-chain value. Historically, whenever this occurs, Bitcoin tends to move sideways while maintaining a broader downward trajectory.

Source: Alphractal
Derivative traders are already aligning with this sentiment. According to the Taker Buy/Sell Ratio, which determines whether buying or selling pressure dominates, sellers currently have the upper hand.
Over the last 24 hours alone, taker sellers have driven volume down to negative $92 million. This means that the asset has continued to slip lower on the chart, further increasing the risk of a breakdown.
However, AMBCrypto also found that there is still a possibility that Bitcoin could stage a rebound, based on another key metric.
New criteria for a rebound
There remains a chance for a rebound in the market. This outlook is based on an analysis of the True Market Mean – An indicator that tracks the average purchase price of Bitcoin across the market.
This level, positioned at $81,900 at press time, could determine whether the market enters a fully bearish phase or remains only mildly bearish.

Source: Glassnode
A breakdown below this zone could expose Bitcoin to a far deeper correction, potentially mirroring the severity of the bear market seen in 2023.
For now, the True Market Mean remains Bitcoin’s final key support before a more significant decline emerges in the market.